Algebra 1 B - 10b Graphing with Pennies Tutorial
Go to Desmos.com launch the calculator.
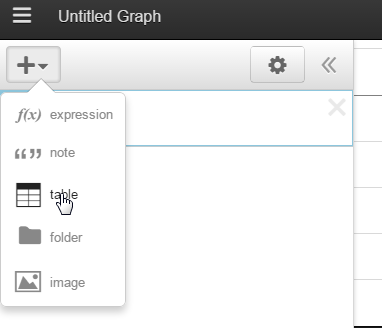
Add a table.
Add a table.
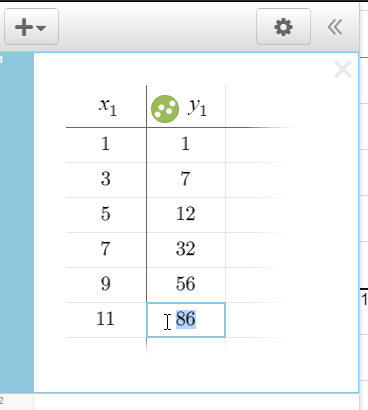
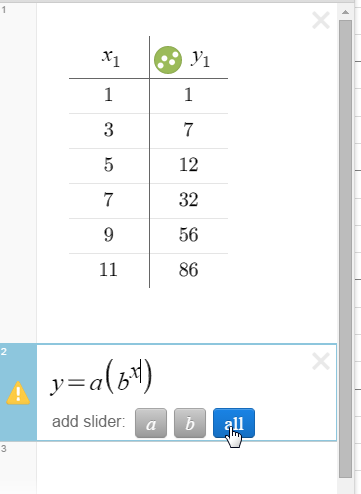
Input your data (this data is from a student group)
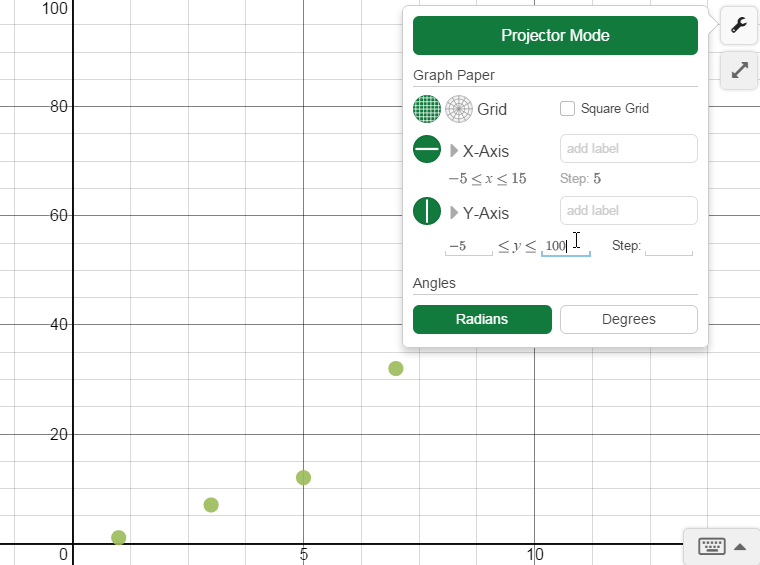
Set you window range so you can see your data (just a little bit helpful).
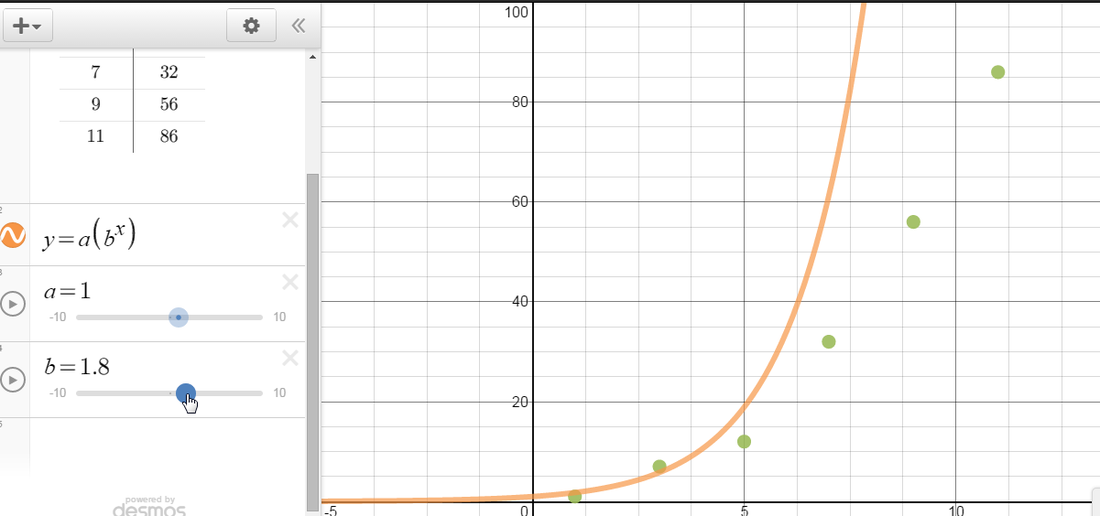
Try to fit an exponential function to the data. Using the sliders find your best fit and give the function in y=a(b)^x form.
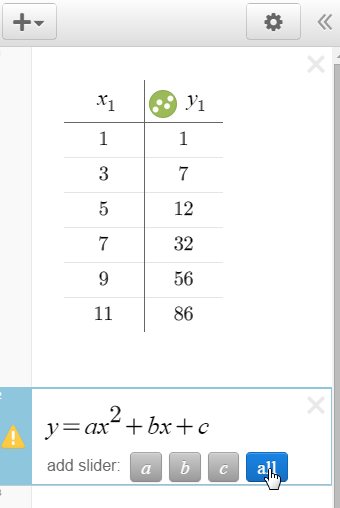
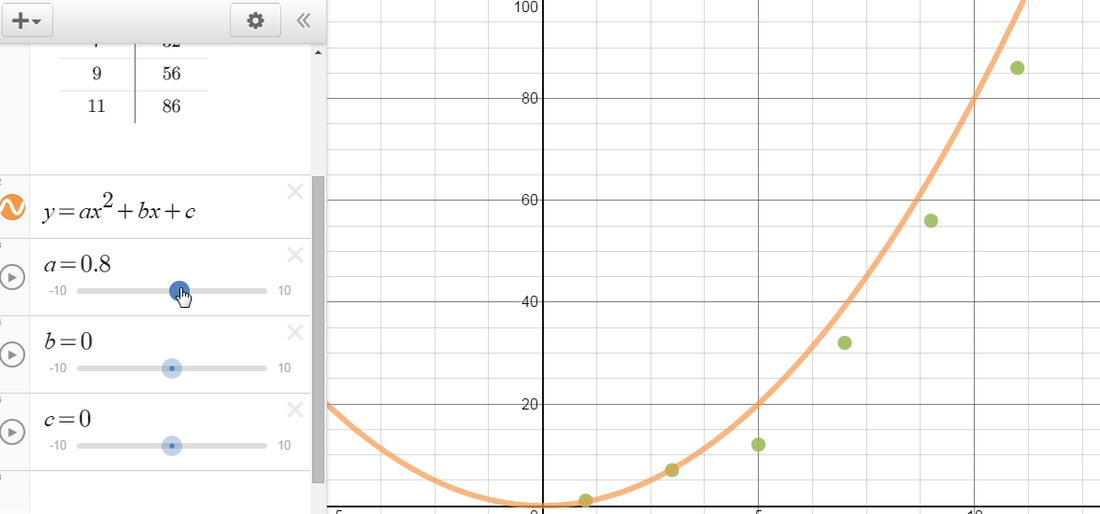
Try to fit a quadratic function to the data. Using the sliders find your best fit and give the function in y=ax^2+bx+c form.