Alegbra 1B - Chapter 8.5 Homework (ocho y Media)
We have this slight problem with our Algebra book; it doesn't cover everything we need to cover in the Common Core State Standards. The slight head nod it gives to probability is helpful but not near enough for our purposes. Also, we need to cover statistics sometime this year. Your book doesn't do this at all. Ever.
So... when I thought of where I wanted to place this material, I could either have waited until second semester when we finished the book, or I could teach it before the science fair. I opted for the second option.
And because I'm not a very inventive person, and because we're squeezing it in between chapters 8 and 9, I opted to calling this chapter 8.5
Week of 10-31-2016
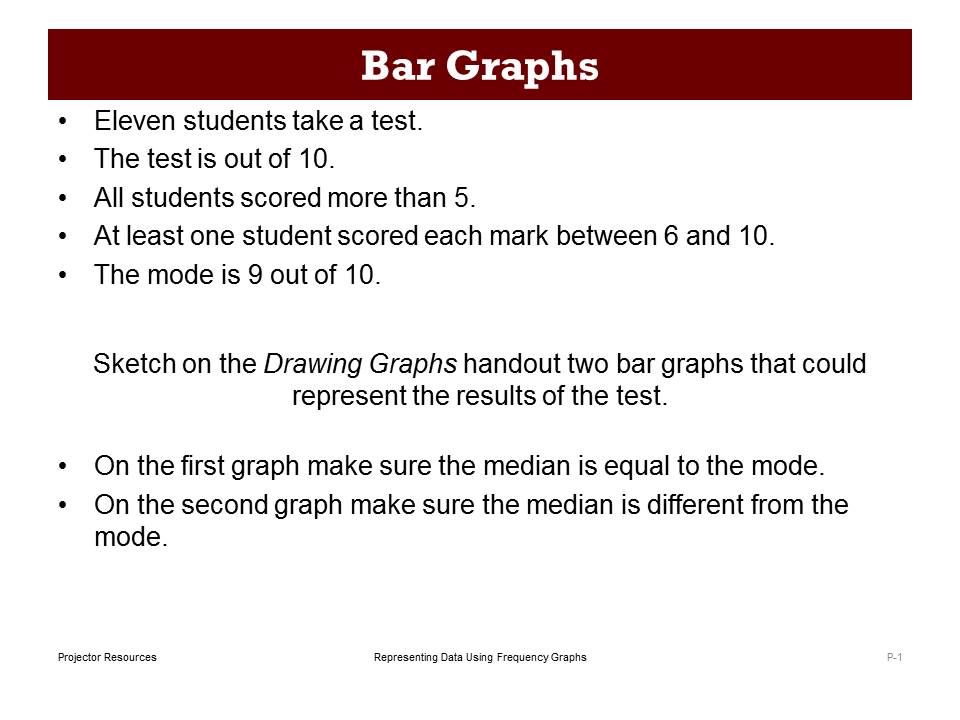
8.5.1) Representing Data 1: Using Frequency Graphs
|
Day 1: Drawing Graphs and class discussion
Practice: Cell Phones 1 (this was assigned with the ch8 test)
| ||||||||
I have some professional development I need to attend. Because I'll be gone, we're going to switch things around a little bit. We'll come back to Representing Data 1 on Wednesday.
Week of 11-07-2016
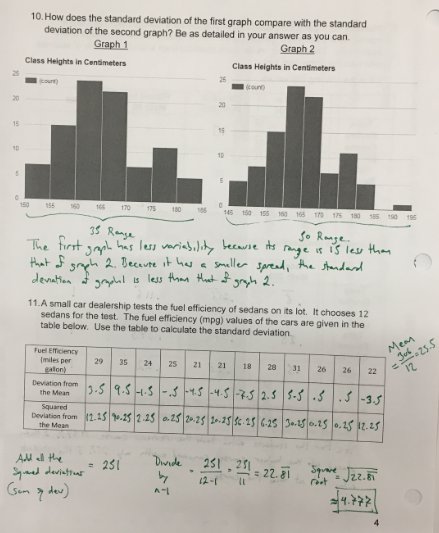
8.5.3) Standard Deviation
|
Day 1:
Practice: Standard Deviation Packet Day 1
Day 2:
Here is a quick "how to" on calculating standard deviation using Google Sheets. Practice: Standard Deviation Packet - Day 2
| |||||||||
Here we go back to Representing Data as promised!
8.5.1) Representing Data 1: Using Frequency Graphs
|
Day 2: DESMOS Card sort--matching frequency graphs and descriptions
Go to student.desmos.com 2nd period class code: 9TXSR 4th period class code: A7BP5 Practice: Cell Phones 1 Revisited AND Cell Phones 2 |
| |||
| ||||||||
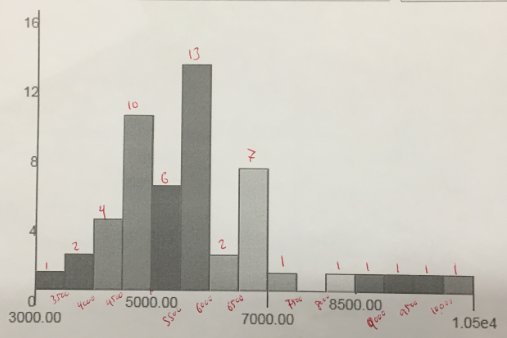
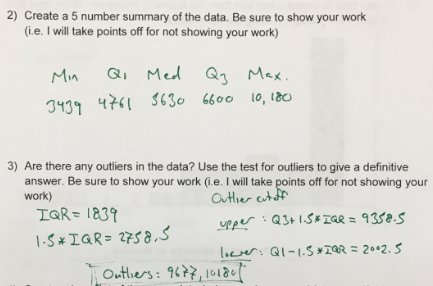
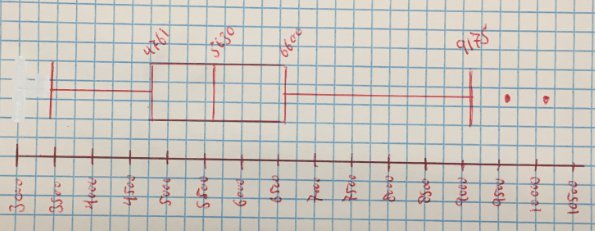
8.5.2) Representing Data 2: Box Plots
| |||||||||||
Fri - Discuss questions on standard deviation from Monday and Tuesday from the substitute teacher
Week of 11-14-2016
Here is the link to our school-wide election results!
8.5.3) Representing Data 2: Box Plots
|
Day 2: Discuss IQR and Test for Outliers
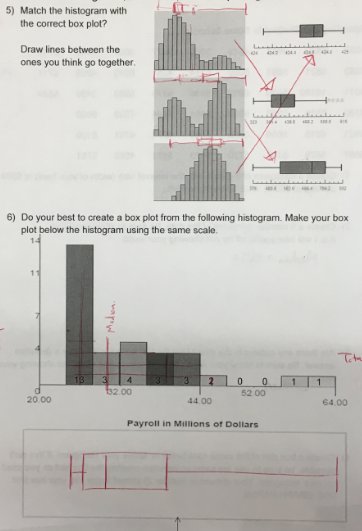
Matching Height Activity - Here is a link to a class set of data if you were not here. Here is a link to the directions. Whiteboarding matching box plots to frequency graphs Practice: Class Heights Frequency Graph and Box Plot with the same scale on graph paper. AND IQR and Outliers Worksheet
| |||||
AMC 8 Math test in class
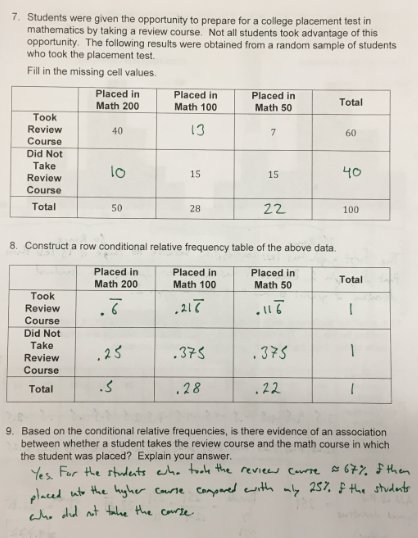
8.5.4) Categorical Data
Look at our school's Presidential election results.
Look at our school's Presidential election results.
| |||||||||
Week of 11-28-2016
|
8.5.5) Review: Practice Test
|
| ||
|
#1
#2, 3
#4
#5, 6
#7, 8, 9
#10, 11
|
Chapter 8.5 Notebook Check
Chapter 8.5 Test
