Day 1: Snowboard Quadratic -- Intro to Quadratic Transformations
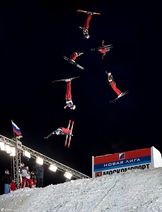
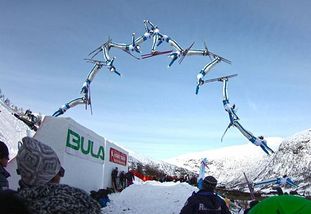
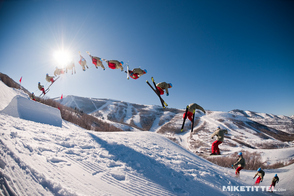
Here are 10 time-lapse photos of people being awesome while someone with a camera is freezing:
Section 1:
1) Choose 2 of the pictures of skiers in Section 1.
2) Click on either the heading or the picture to go to the attached Desmos file.
3) Using the sliders, find 'a', 'h', and 'k' values to fit a quadratic equation onto the skier/snowboarder's path while they are in the air.
4) Describe how you got your function to match the path of the athlete.
5) What relationships can you find between the graph and your 'a', 'h', and 'k' values?
http://wiki.fis-ski.com/index.php/Freestyle_skiing
|
http://wiki.fis-ski.com/index.php/Freestyle_skiing
|
|
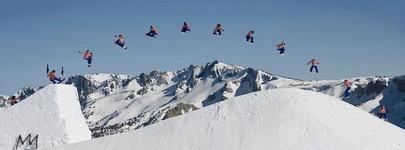
3) Cliff Jump
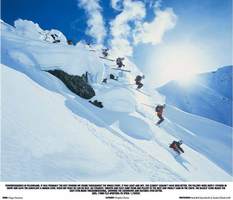
http://www.feedthehabit.com/skiing/red-bull-alaska-snowthrill-2002/
|
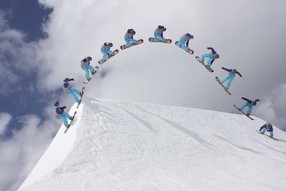
4) Half-Pipe
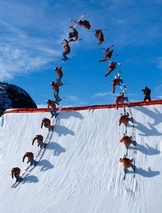
http://www.apnatalks.com/wp-content/uploads/2013/06/world-amazing-facts-2.jpg
|
Section 2:
|
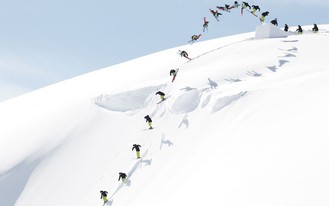
1) Choose 2 pictures of skiers/snowboarders from section 2.
2) Click on either the heading or the picture to go to the attached Desmos file. 3) Describe what happens to the graph as the a-value gets larger? What about when 'a' is negative? 4) How does the graph change when you change the h-value? Be specific. 5) How does the graph change when you change the k-value? Be specific. 6) Given a graph, how would you find the values for 'h' and 'k' without sliders? |

|
|
7) Snow Board
http://www.redbullillume.com/en/gallery/final-images-2013/top-50.html
|
8) Snow Board
http://www.lucaskane.com/index.php#mi=2&pt=1&pi=10000&s=12&p=0&a=0&at=0
|
Section 3:
|
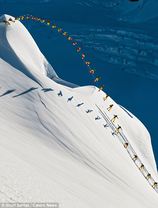
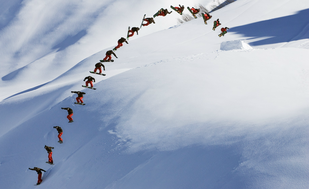
1) Now, only choose 1 of the pictures of snowboarders from section 3.
2) Click on either the heading or the picture to go to the attached Desmos file. 3) This time there will be one difference between these pictures and the previous section--I will have the vertex point plotted on the graph. 4) Revisit your explanation to #6 in section 2: "Given a graph, how would you find the values for 'h' and 'k' without sliders?" How would you change your explanation (if at all)? 5) After you find the 'h' and 'k' values for a graph, how can you find the 'a' value? |
|
|
9) Snow Board
https://www.flickr.com/photos/jack-davies/5663888548/
|
10) Snow Board
https://twitter.com/Cmdr_Hadfield/status/432530856742117376
|
|
Student Handout for Day 1:
| |||
Day 2: Modeling Data
Situation 1:
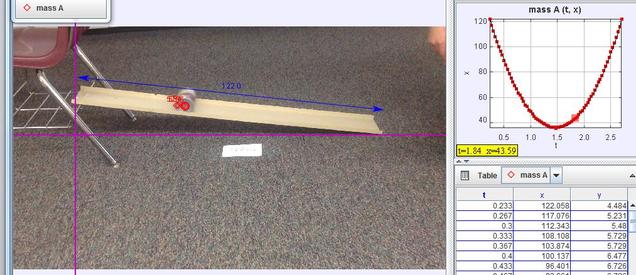
Here's a simple situation--rolling an object up and down a ramp. In this case, it's a soup can. (Don't judge me.) I measured the distance the can from the left-hand side of the ramp. A quick video of the situation is on the left. The little red dots you see track the location of the soup can in relationship to the purple (magenta?) set of axes.
|
|
|
Here's a screenshot of the graphed data.
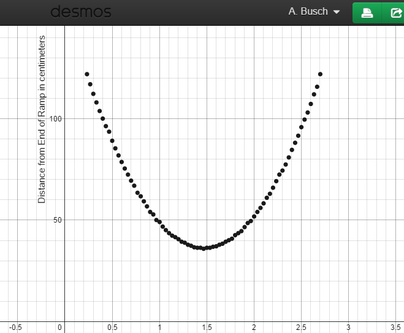
Describing/modeling the situation using math isn't simple but it's not out of your reach either--we did this yesterday. Except today, we're not going to use sliders.
|
1) Open up the Desmos page with the data.
2) Using what your learned from the snowboard quadratic lesson above create an equation in vertex-form (to the right) that models the data . 3) Be sure to include all of your work, including either a screenshot or a printed page of your graph working in Desmos. |
Vertex Form of a Quadratic Equation

|
Situation 2:
There's nothing like a little bit of basketball to soothe the soul... unless you're terrible at it like me.
In this situation, the graph is a little messier.
1) Open up the Desmos page with the data.
2) Create an equation in vertex-form modeling the data.
3) Be sure to include all of your work, including either a screenshot or a printed page of your graph working in Desmos.
1) Open up the Desmos page with the data.
2) Create an equation in vertex-form modeling the data.
3) Be sure to include all of your work, including either a screenshot or a printed page of your graph working in Desmos.
|
Student Handout for Day 2:
| |||
